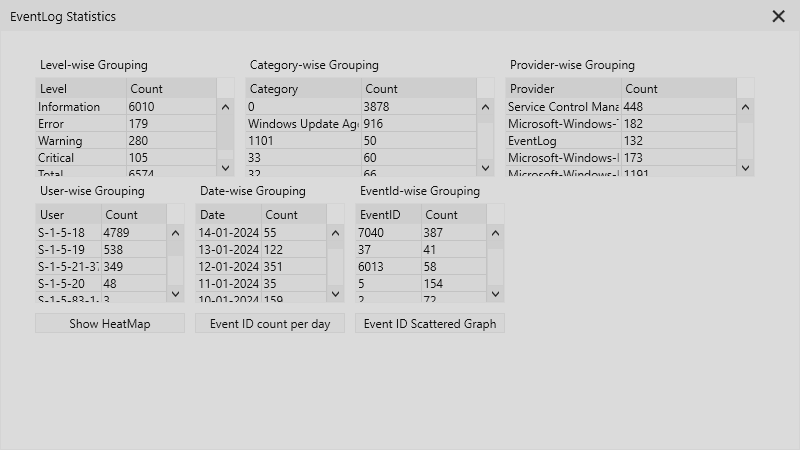
Event Log Viewer provides a rich set of event statistics and visual representation of these events in various forms. In this section, we will understand everything about statistics that are available in Event Log Viewer tool.
Count of Events per level (Level-wise Grouping)

This section of statistics show you how many events you have per level. This gives you a brief idea about the system and you know what you are dealing with before you dive deep.
Count of Events per Category (Category-wise Grouping)


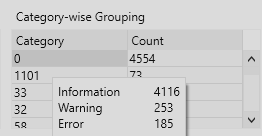
This section of statistics shows the number of events logged per event category. If you hover over it, you can also see the level-wise grouping of events for the specific category. This level of granularity and details helps you in various ways while reviewing the windows event logs and while you try to make sense out of it.
