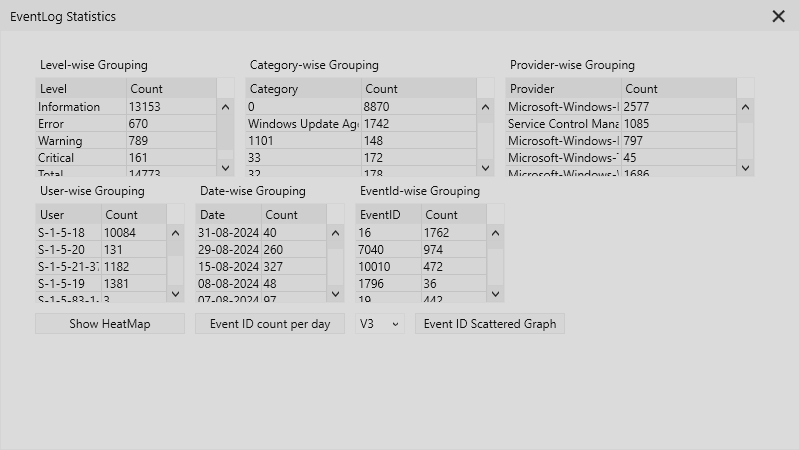
Advanced Event Viewer provides a rich set of statistics and visual representation of these events in various forms. In this section, we will understand everything about statistics that are available in Advanced Event Viewer tool.
Count of Events per level (Level-wise Grouping)
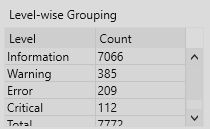
This section of statistics shows how many events there are per level. This gives you a brief idea about the contents of the event log.
Count of Events per Category (Category-wise Grouping)
This section of statistics shows the number of events logged per event category. By hovering over it, it shows the level-wise grouping of events for the specific category. This level of granularity and details can help while reviewing the event logs and to make sense of it.
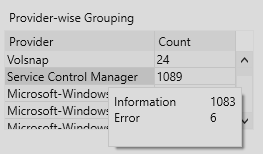
Count of Events per Provider(Provider-wise Grouping)
This view shows the number of events logged for each provider found in the given source. Hovering over it shows the count of events per level which helps in understanding if the specific provider is logging a specific level of events more.
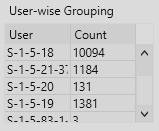
Count of Events per User (User-wise Grouping)
This view shows the count of events logged per user. This generally shows the SID of the user.
Count of Events per Date(Date-wise Grouping)
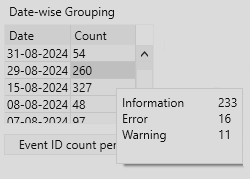
This view shows the count of events logged per date. By hovering over it, you can see a level wise grouping which helps in understanding the break-up of events per level for the given date.
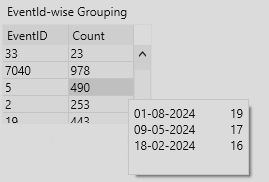
Count of Events per Event ID (EventId-wise Grouping)
This view shows you the count of events logged per Event ID. By hovering over it, it shows the first 3 dates (if available) on which the event id was logged the most.